Effortlessly get insights from raw data in just a few clicks without worrying about managing multiple tools. Everyone in the organization can now leverage the full potential of your data.
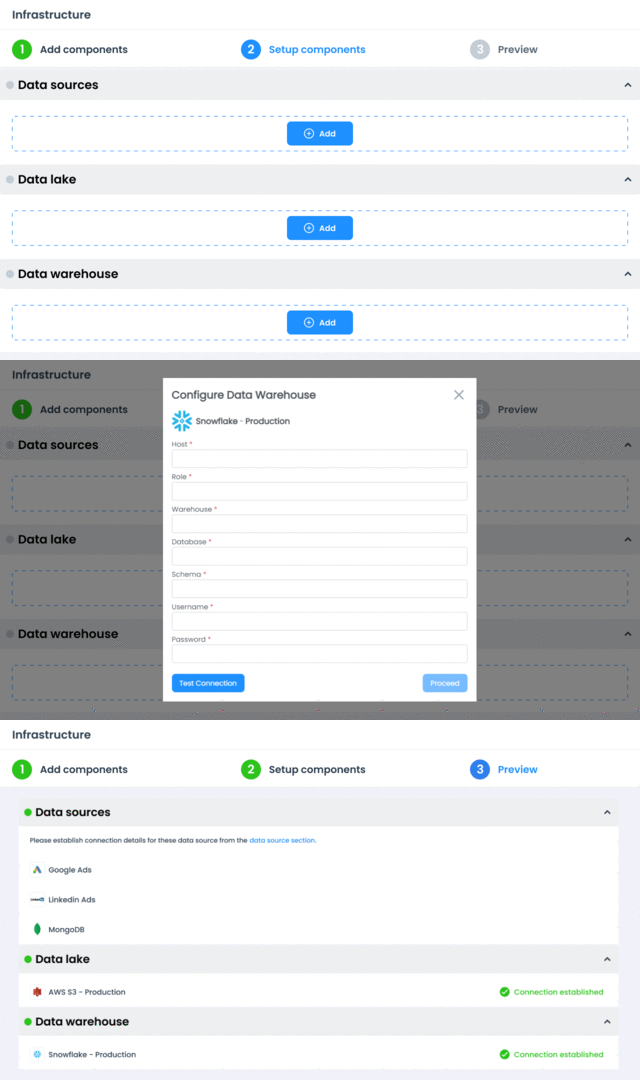
Our on-the-platform guide will help you understand the most commonly used data architectures.
With MapleMonk, anyone can now build a scalable data architecture!
MapleMonk supports multiple cloud tools including Snowflake, AWS and a myriad of other tools to host your data.
Select tools of your preference without worrying about the technical expertise required in that tool.
You are the sole owner of your infrastructure and data.
Your data and infrastructure created using MapleMonk will be intact even if you choose to discontinue using our platform.

Create pipelines to move data from the source of your choice to the destination of your choice in less than a minute. No Python or SQL scripting needed!
You could further choose the data load types based on your use case – full, incremental, incremental dedupe etc.
Deduplication, Format changes, Replacing nulls, Addition of a new column & many more transformations can be handled through our no-code interface.
These transformation rules can be auto applied for every data refresh, if needed.
Schedule these pipelines based on your context. MapleMonk supports both time and trigger based scheduling.
Monitor the status of all the pipelines in a single dashboard with details such as ‘Time taken to run’, ‘Records updated’, ‘Reason for failure’ (if failed), etc.
You will also be alerted regarding data pipeline failure and its impact on metrics & reports to initiate immediate action.
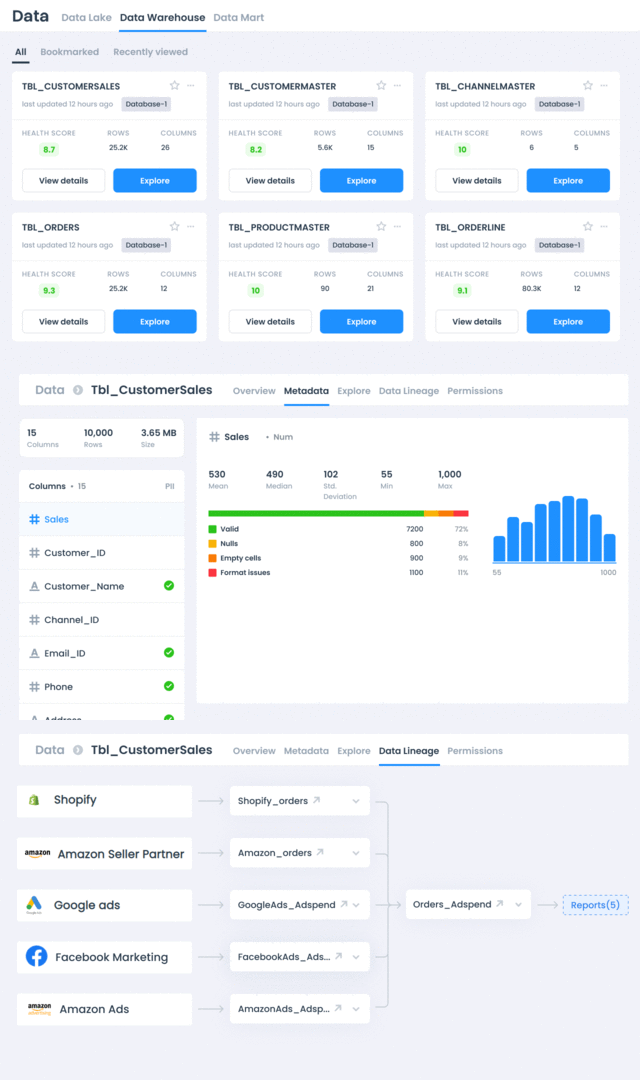
Access data assets across your Lake, Warehouse or Data Marts in one place (if you have relevant permissions).
Find any data asset and its context using our powerful search driven by a detailed data catalog. Every table, file and column can be cataloged with detailed descriptions, tags, owners, etc.
Get full visibility into journey of every data asset, simplifying the root cause analysis and improving confidence in data.
Identify data origin, changes, utilization across other tables, metrics and reports over time.
Get a quantitative health score for each data table based on multiple parameters like Nulls, Format issues, Duplicates, Missing values etc.
Easily identify tables that are to be fixed so that every table can always be analysis ready!
Export to excel, CSV or share any data asset on MapleMonk with relevant team members with the click of a button.
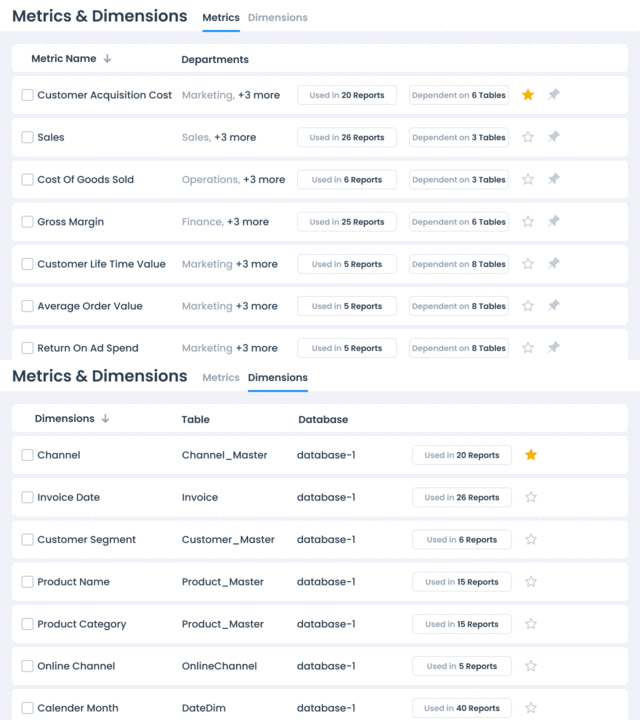
Access all the metrics created in your organization and utilize them easily from a single place. Publish reusable metrics with description to avoid definition inconsistency, source table mismatch and rework.
Access all the available dimensions at one place to slice and dice your metrics.
Choose metrics & dimensions based on your use case and create a custom table for reporting.
Create an organization level repository of all your reports, whether they are on Power BI, Tableau or simply on excel, for easy discovery and avoiding rework.
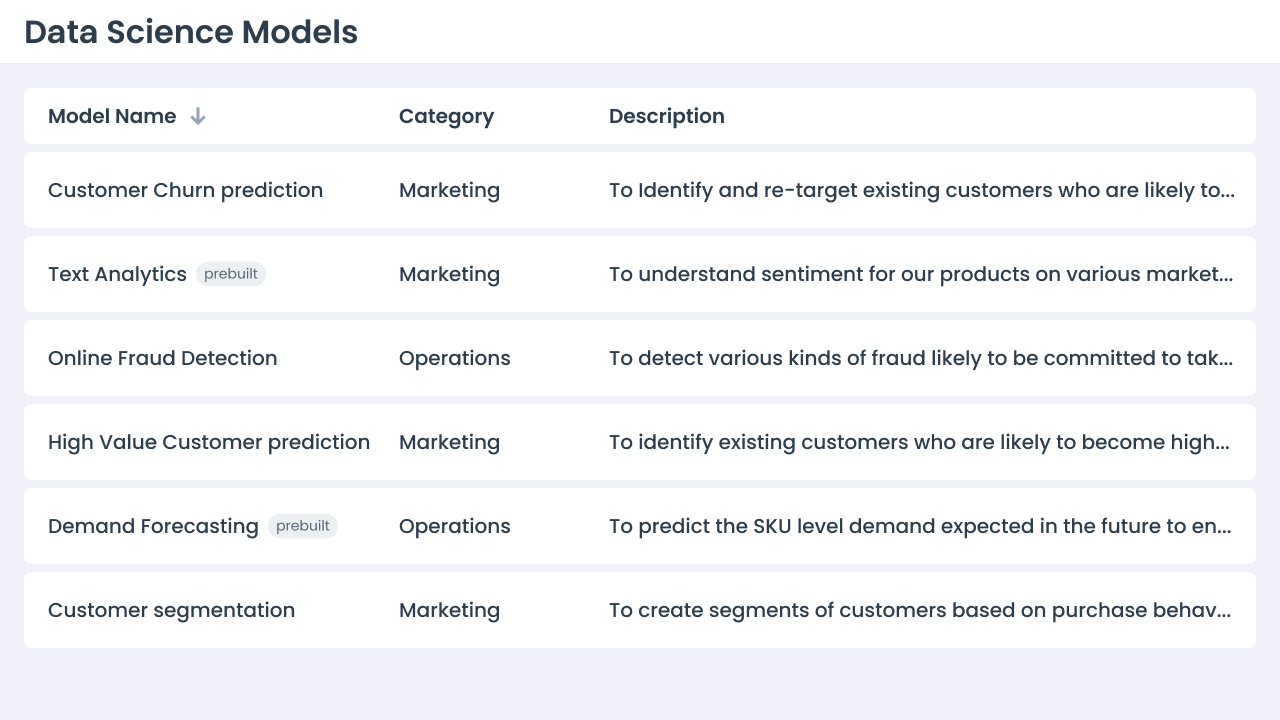
Augment your organization’s analytical capability with our pre-built Advanced Analytics and Data Science modules for use cases like Demand Forecasting, Text Analytics, Marketing Mix Modelling etc.
Enable data scientists & analysts to productionize their custom models using MapleMonk platform so that business users can seamlessly leverage these models for insights.
Get tailored insights auto-generated from your data based on triggers & data trends. This will enable everyone in the organization to spend time on decisions rather than drowning in reports to identify unusual behaviors.
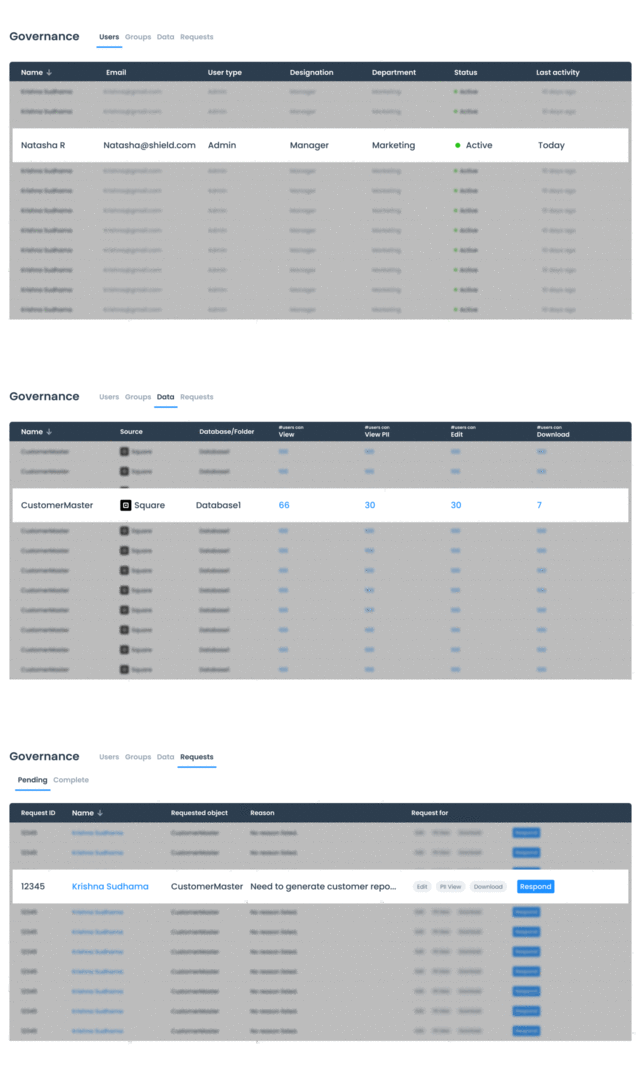
Manage individual or group level data access permission all from a single command centre.
Get a quick snapshot of how many users have view, edit or download access of all your data assets.
Easily manage all your pending access requests for any data asset in the organization.
Mask Personally Identifiable Information & sensitive information to restrict access for a specific user or a group.